Why Use a Composite Market Score?
A Historical Case Study: Q4 2018
SPY tells us where headline price has already traded. VIX reflects the options market's pricing of short-term risk. A composite score summarizes whether the internal environment supporting the market—across trend, breadth, rates, and risk—is robust or quietly deteriorating.
Core Empirical Finding
“The market hadn't broken yet. The environment had.”
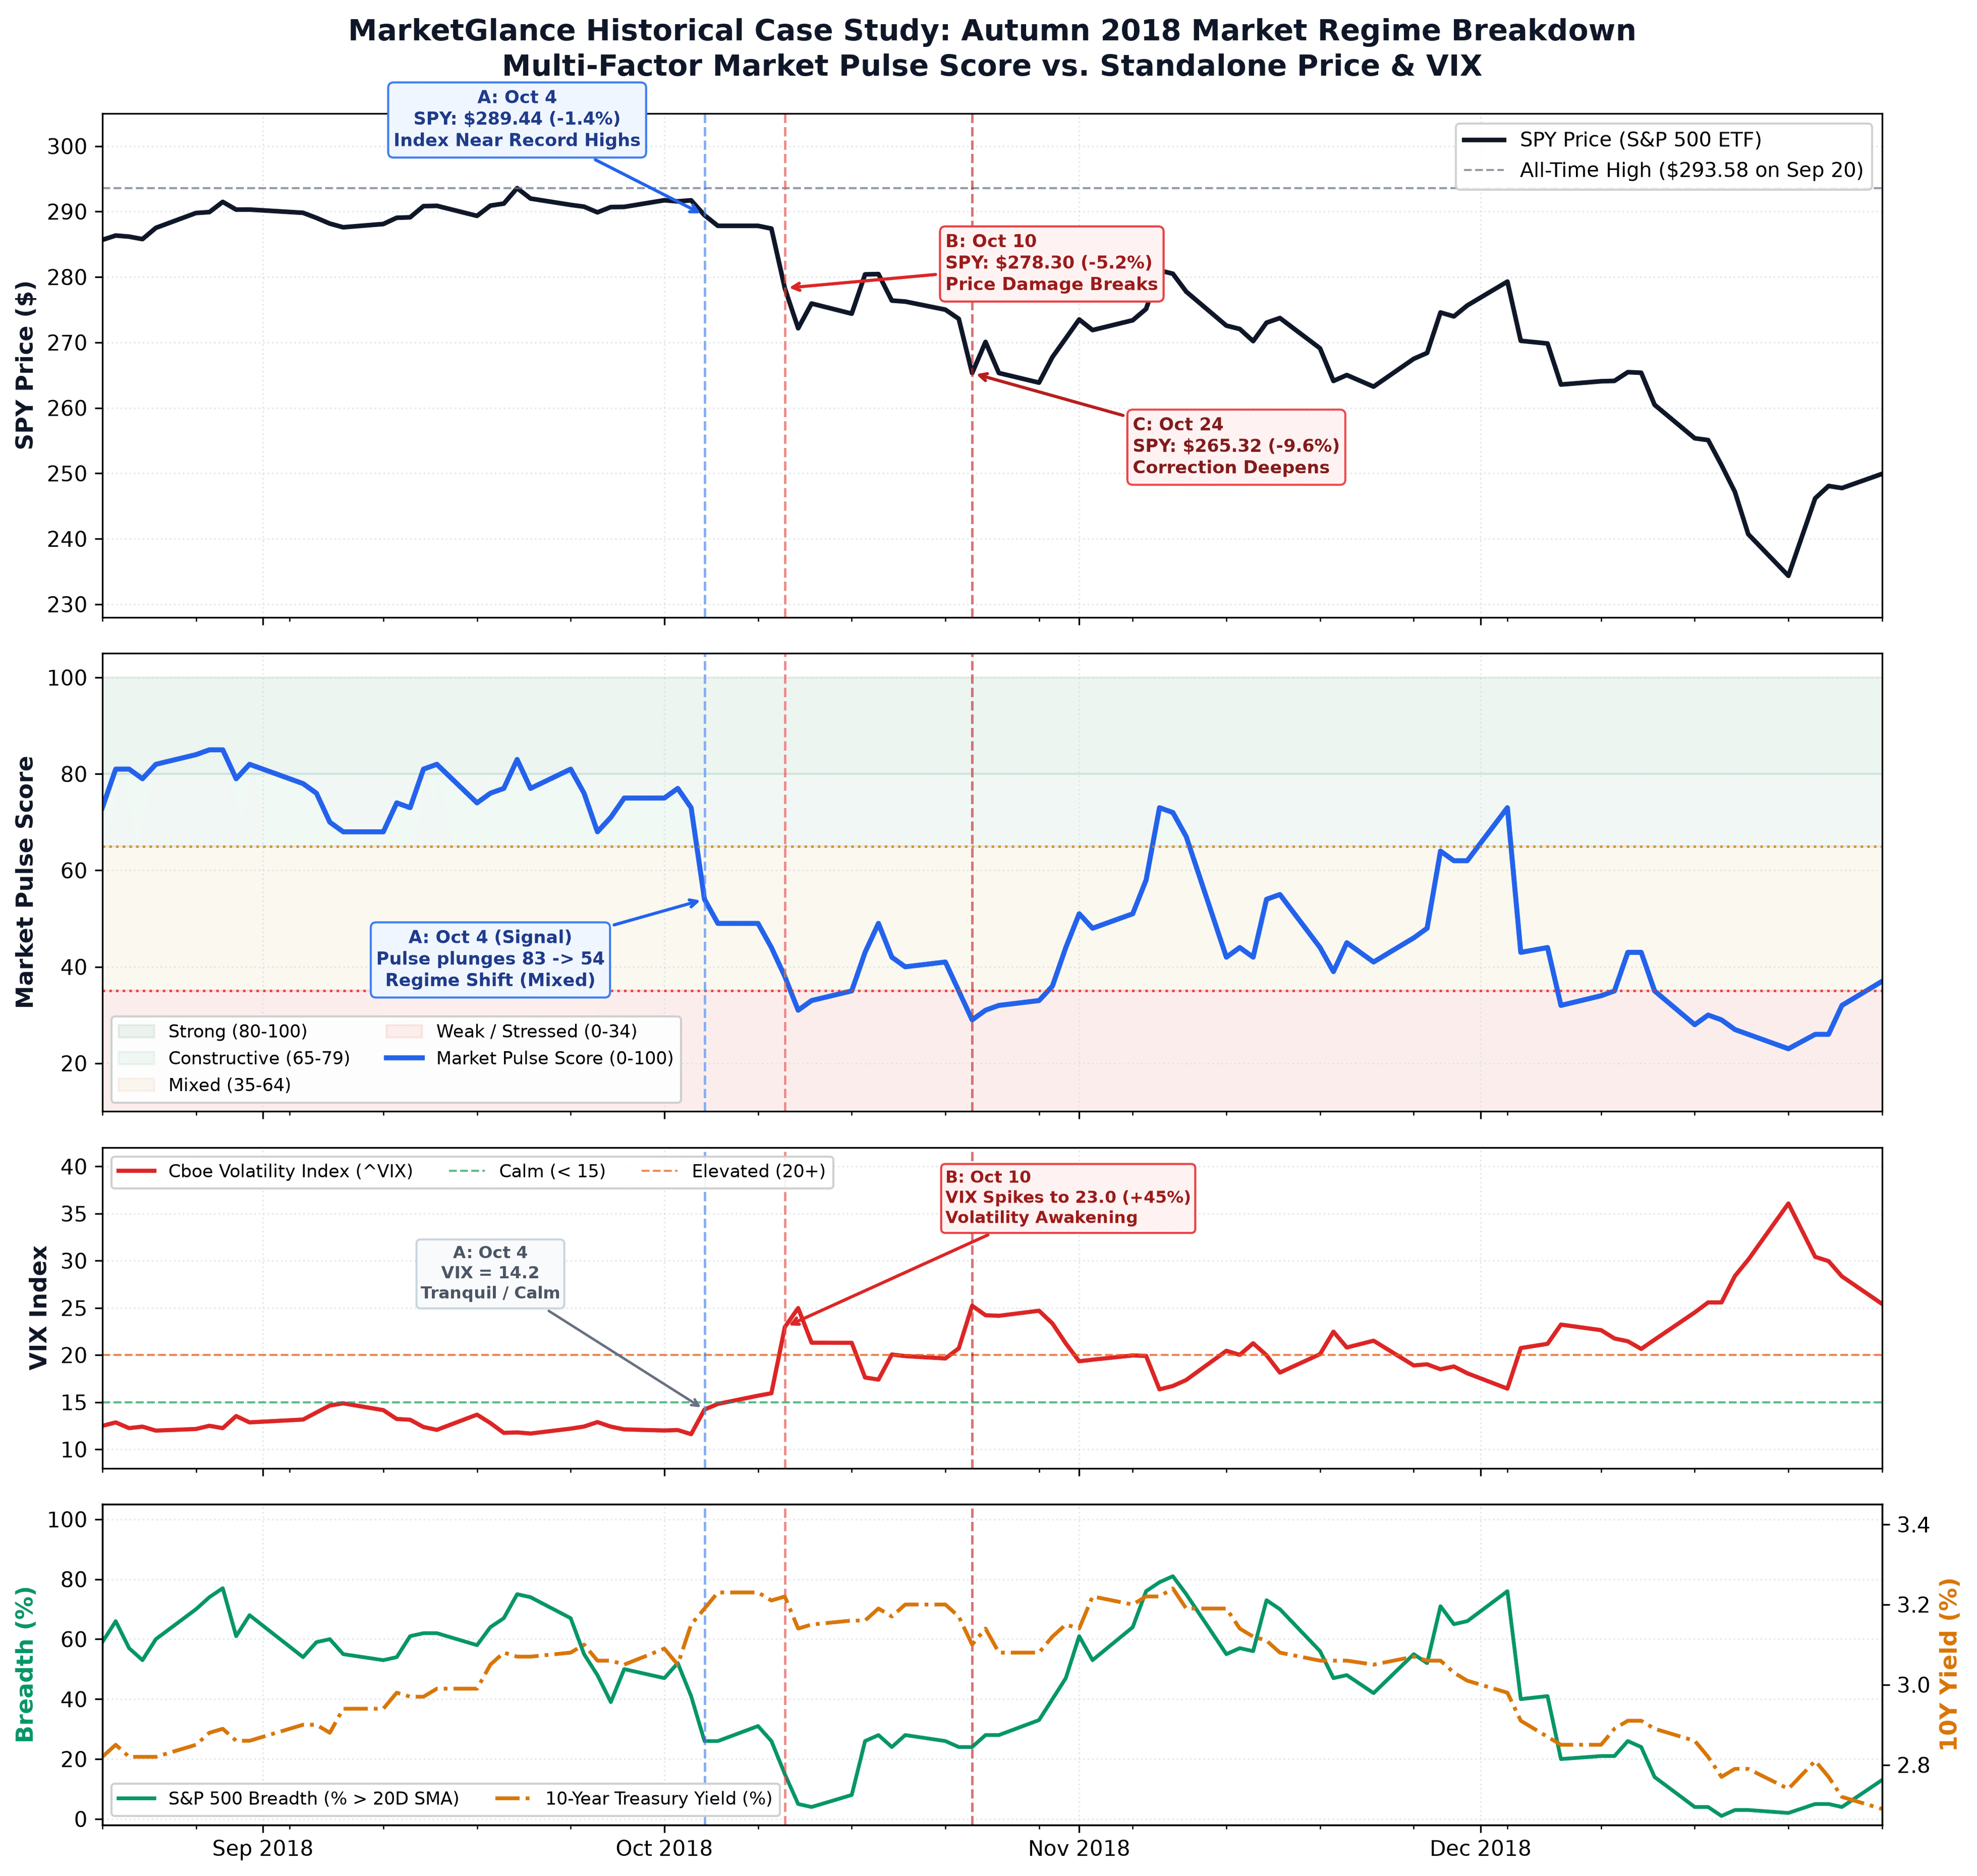
On October 4, 2018, SPY was just 1.4% below its all-time high and VIX remained calm at 14.2. Yet underneath, market breadth had collapsed to 26%, 10Y Treasury yields surged past 3.19%, and Market Pulse plunged from 83 to 54. Four sessions later, headline price broke and VIX spiked +45%.
Timeline Overview
Three Phases: From Calm Surface to Internal Fracture
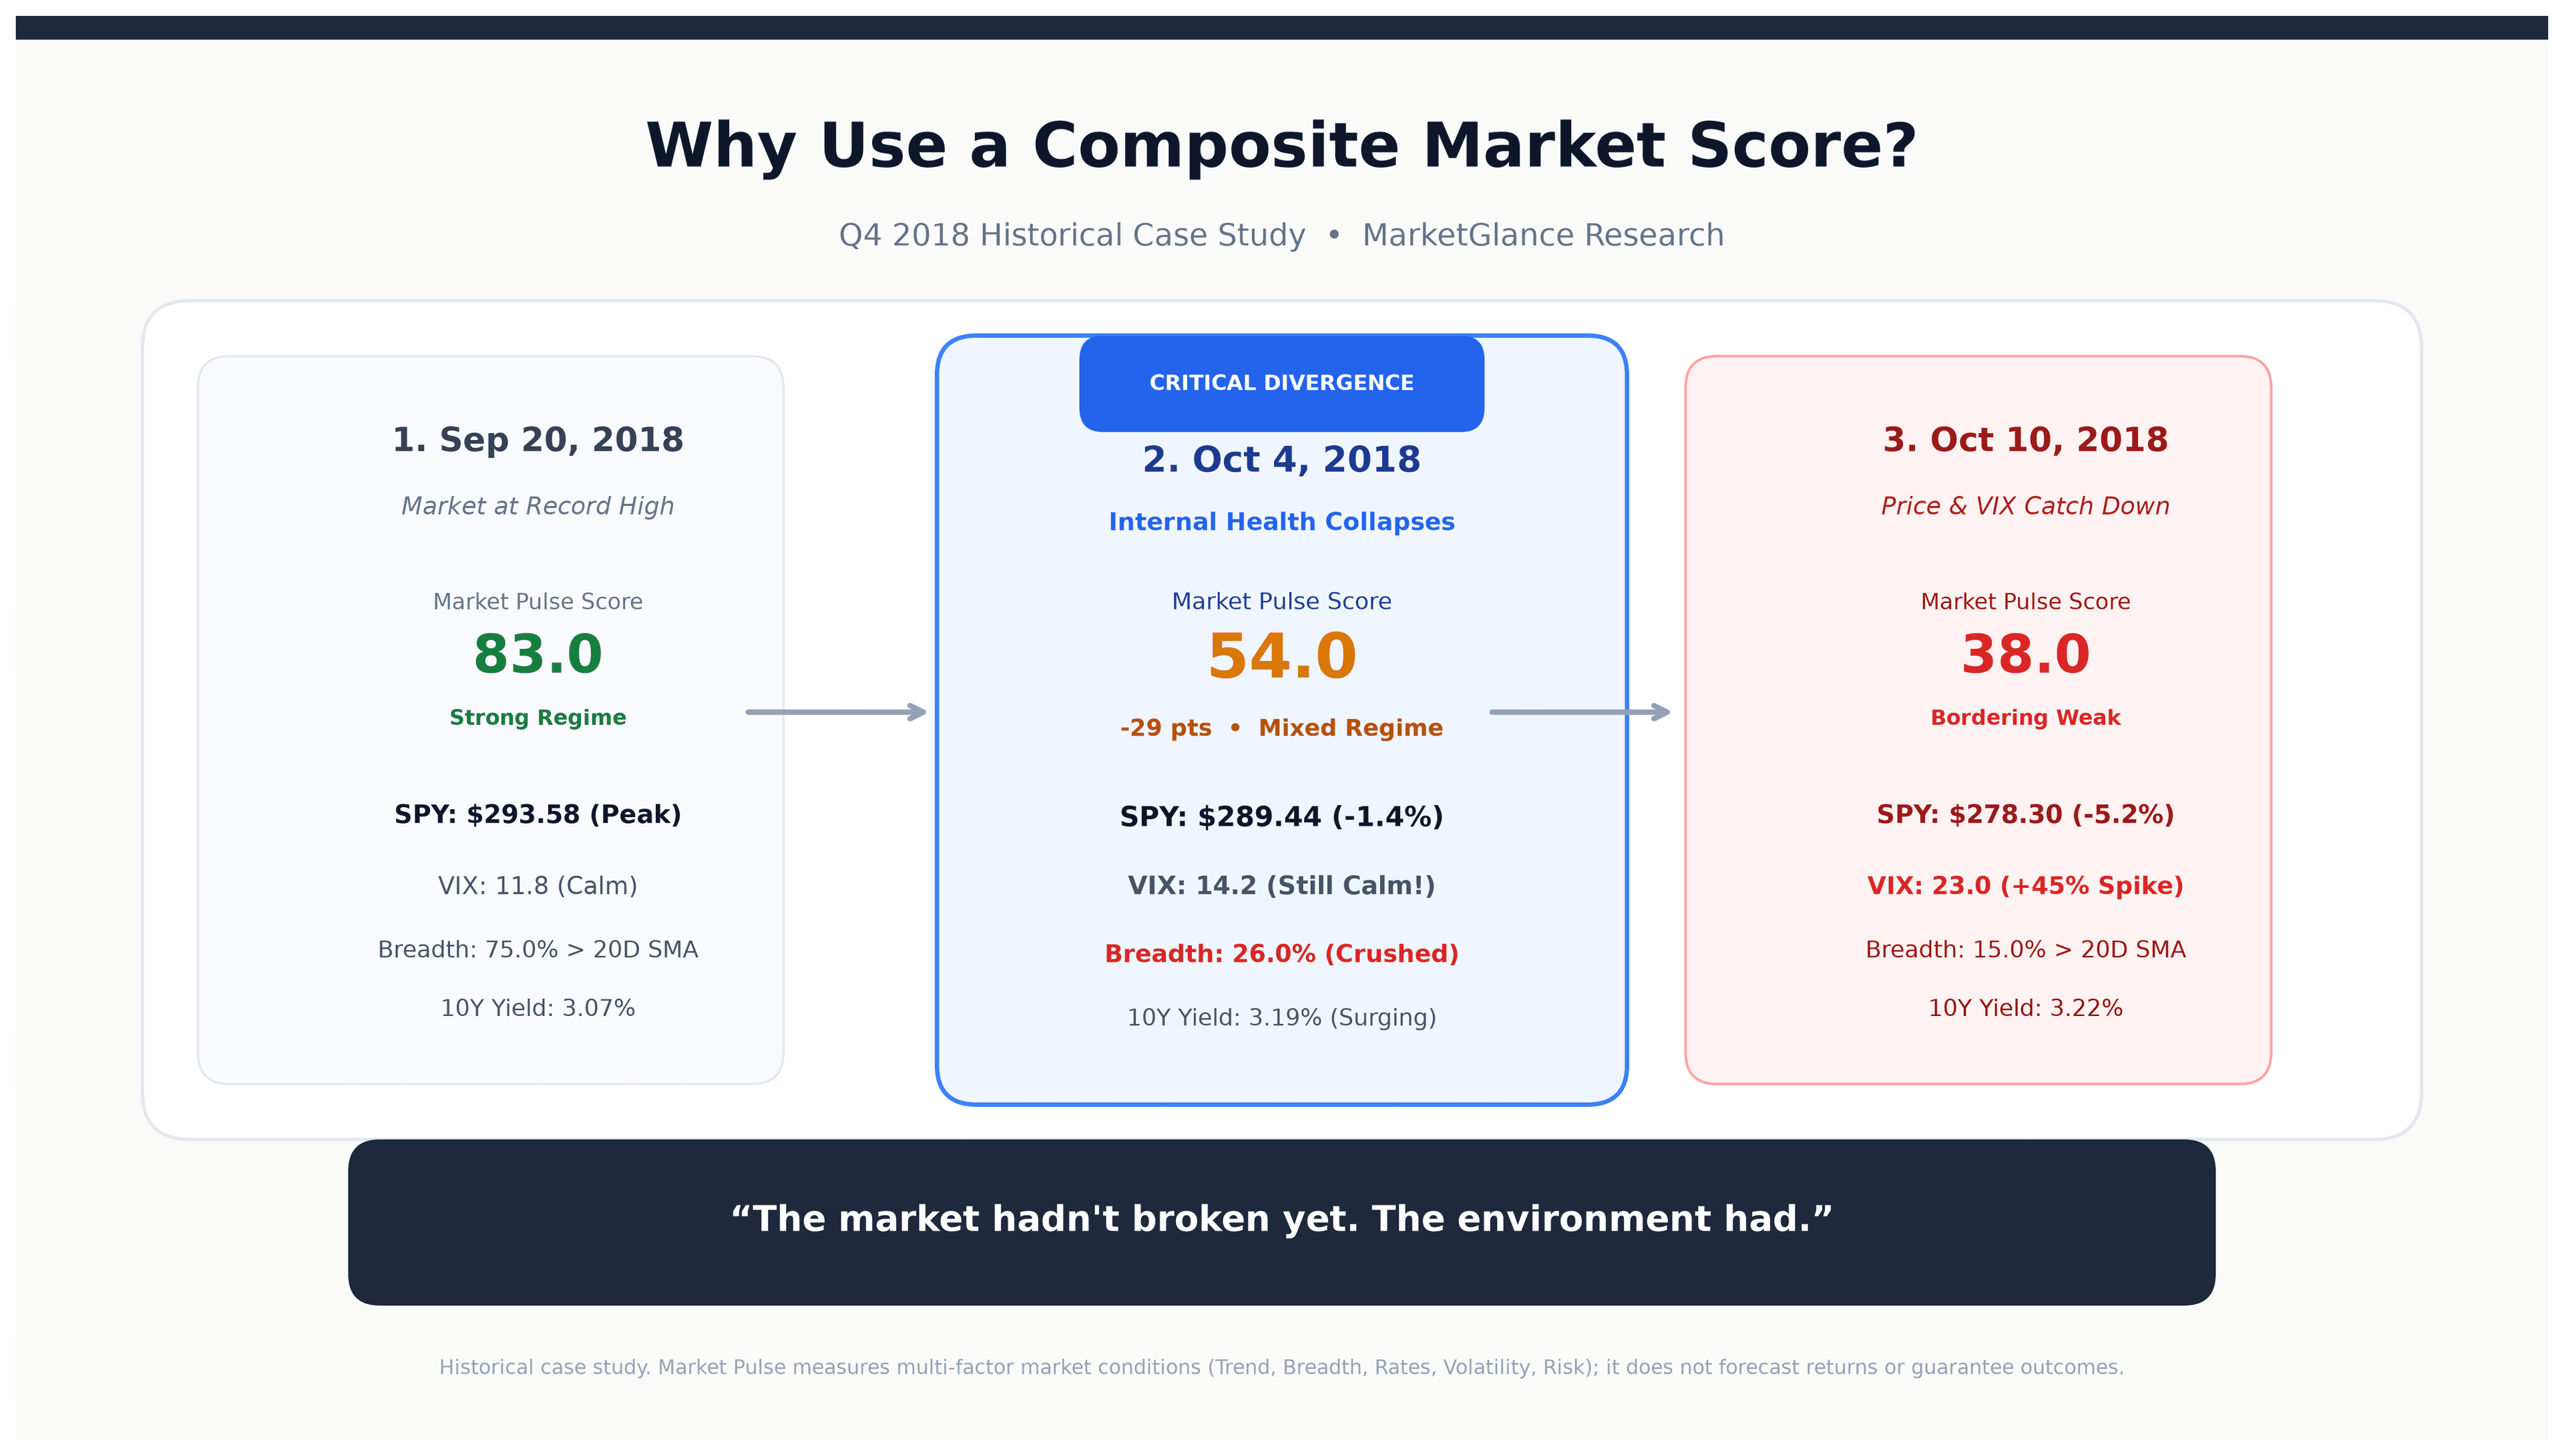
Figure 1: Key milestone progression in Autumn 2018 (Market Pulse V1.1 historical replay against canonical market series)
Verified Historical Milestones
Key Indicator Comparison Across Key Dates
| Date & Milestone | SPY (vs Peak) | Market Pulse | Regime | VIX | Breadth (>20D SMA) | 10Y Yield |
|---|---|---|---|---|---|---|
| 2018-09-20SPY All-Time High | $293.58 (0.00%) | 83.0 | Strong | 11.80 | 75.0% | 3.07% |
| 2018-10-04★ Critical Divergence | $289.44 (-1.41%) | 54.0 (-29 pts) | Mixed | 14.22 (Calm) | 26.0% (Crushed) | 3.19% (Surging) |
| 2018-10-10Risk Visibly Surfacing | $278.30 (-5.20%) | 38.0 | Weak | 22.96 (+45%) | 15.0% | 3.22% |
| 2018-12-24Ultimate Trough (Christmas Eve) | $234.34 (-20.18%) | 23.0 | Stressed | 36.07 | 2.0% | 2.74% |
Multi-Panel Time Series
Tracking Price, Score, VIX, Breadth, and Rates
Component Anatomy
What Market Pulse Was Seeing on October 4
Market Pulse is not a single indicator; it assesses five distinct pillars of environmental health simultaneously. On October 4, while a handful of mega-caps kept headline SPY near its peak, multiple underlying pillars had deteriorated:
75% Down to 26%
While SPY was down just 1.4%, nearly 3 out of 4 constituent stocks had fallen below their 20D SMAs. A narrow group masked broad-market weakness.
10Y Yield > 3.19%
Fed Chair Powell noted rates were 'a long way from neutral.' Long-term yields broke multi-year resistance, sharply tightening financial conditions.
Small Caps & Semis Lagged
High-beta assets and small-cap indices began underperforming defensive sectors, reflecting institutional risk-off rotation.
Conceptual Role
Why Complement SPY and VIX with Market Pulse?
| Indicator | What It Mainly Measures | Behavior on Oct 4, 2018 |
|---|---|---|
| SPY | Headline broad-market price | -1.41% (Surface looked perfectly healthy) |
| VIX | Options market implied volatility | 14.22 (Still in tranquil territory) |
| Market Breadth | Broad constituent participation | 26.0% (Nearly 3 in 4 stocks falling) |
| Treasury Yields | Discount rate and rate pressure | 3.19% (Multi-year rate breakout) |
| Market Pulse | Multi-factor composite market condition | 83 → 54 (Mixed), captured internal deterioration |
Scientific Boundaries
What This Demonstrates (And What It Does NOT)
✓ What This Case Demonstrates
When structural divergences emerge—where mega-cap indices mask collapsing breadth, rising rates, and waning risk appetite—a composite score can reflect environmental deterioration earlier and more comprehensively than price or VIX alone.
✗ What This Case Does NOT Demonstrate
- Does NOT mean Market Pulse 'predicted a crash': it measures conditions on day T and cannot forecast forward decline magnitude or policy reactions.
- Does NOT mean every score drop leads to a 5% correction: historical replay shows drops often resolve via mild sector rotations or pauses.
- Does NOT replace SPY or VIX: they answer different questions, and Market Pulse serves to synthesize them rather than replace them.
Important changes, delivered to you
Weekly highlights, key data, and major market changes—delivered directly to you.