What 63 QQQ Retests Tell Us About 5-Day and 20-Day Market Breadth
A decade of breakdown–reclaim–retest history and the role of multi-timeframe market participation
Central Research Question
Can 5-day and 20-day market participation help distinguish a healthier QQQ retest from a renewed breakdown?
Research Context & Objective
When major indexes pull back to test key moving-average support levels, headline prices alone rarely reveal whether the underlying market is quietly stabilizing or preparing to roll over. To separate durable support tests from failing bounces, MarketGlance conducted an empirical study of every completed QQQ breakdown–reclaim–retest cycle over the past decade, examining how short-term and intermediate-term breadth dynamics interact during crucial retest windows.
What This Empirical Study Examined
- More than a decade of completed QQQ market cycles (2015–2026)
- Strict 4-step event framework: First Breakdown → Intermediate Low → Reclaim → Second Retest
- Dual-timeframe participation: 5-Day (fast pulse) vs. 20-Day (structural pulse) breadth series
- Conditional historical subgroup classification across distinct market regimes
- Out-of-sample machine learning cross-validation to evaluate universal predictive boundaries
The 4-Step Breakdown–Reclaim–Retest Sequence
Analytical Framework Schematic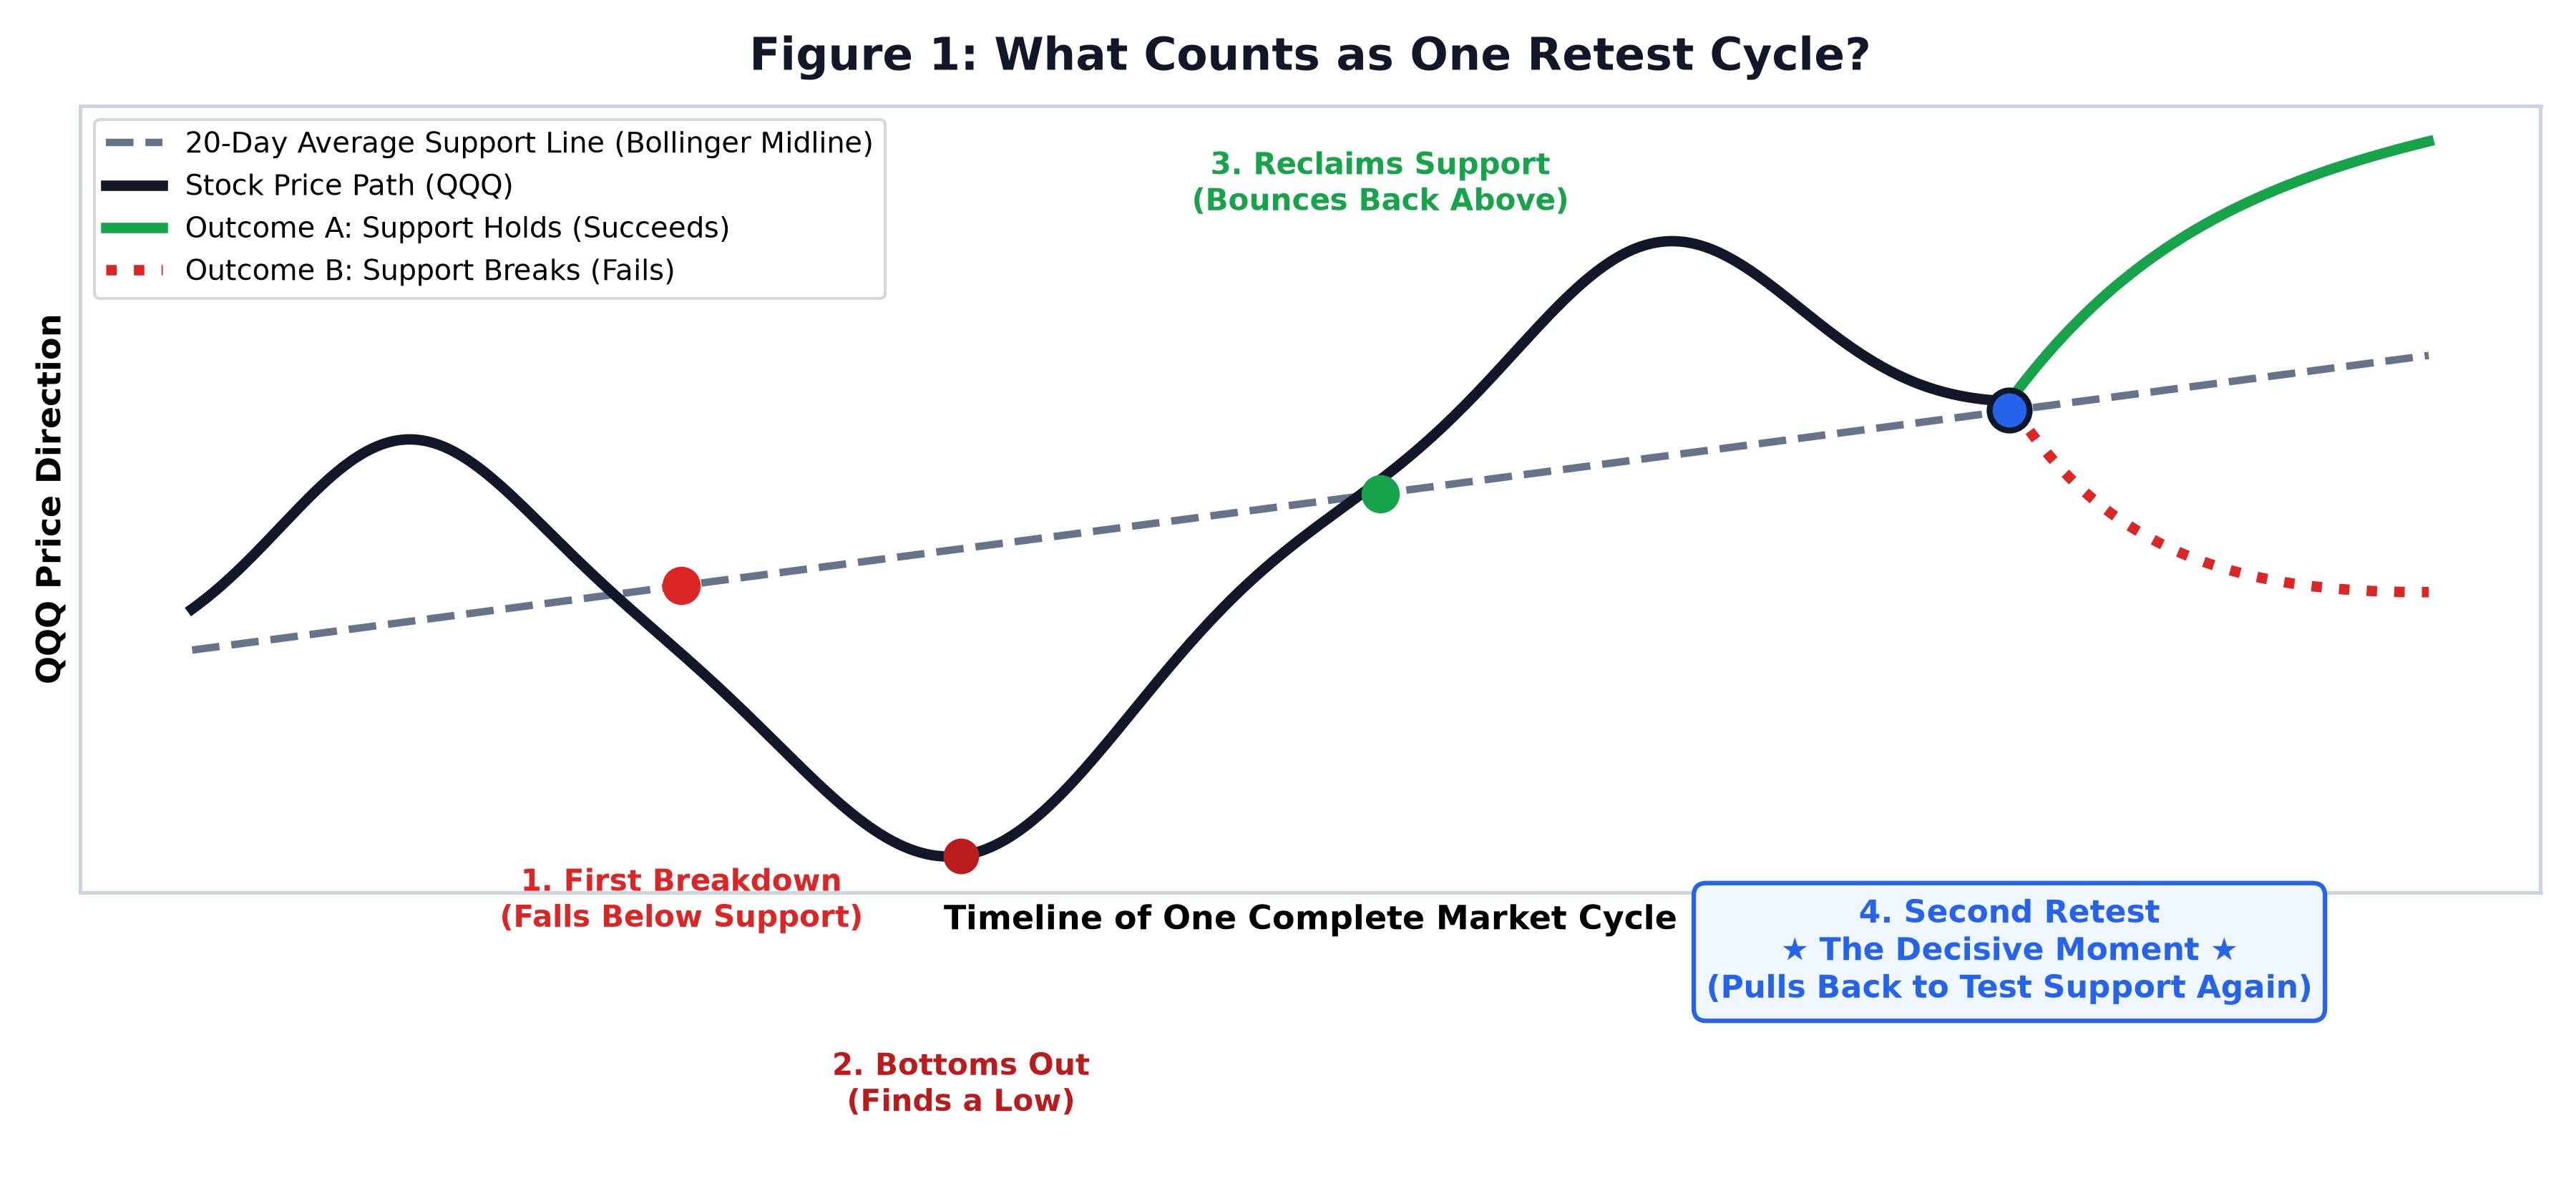
Framework Mechanism: A structured market correction follows a distinct multi-stage progression: initial breakdown below moving average support (B1), finding a bottom low (L), sustained reclaim (R), and a secondary retest of the support zone (T2) before resolving into a support hold or renewed breakdown.
Analytical Significance: Testing support a second time is the natural decision pivot that determines whether a pullback was a healthy consolidation or the start of a deeper decline.
Full Research Note available to MarketGlance subscribers
Subscribers receive the complete historical analysis, subgroup results, model validation, charts, and current-market interpretation through MarketGlance subscriber research updates.
Included in the Full Subscriber Report:
- ✓Complete 63-cycle historical dataset & baseline hold rates
- ✓Conditional breadth subgroup findings & empirical probabilities
- ✓Machine learning cross-validation & statistical robustness scorecard
- ✓Full 6-chart research atlas and high-resolution visuals
- ✓Actionable current-market interpretation & key confirmation / invalidation levels